
Grafana Vision Operator HMI
Grafana Vision (grafana-vision) is Pillar 4’s browser-based Operator HMI, pre-provisioned via provisioning/grafana/ to replace OSIsoft / AVEVA PI Vision without per-seat client licensing.
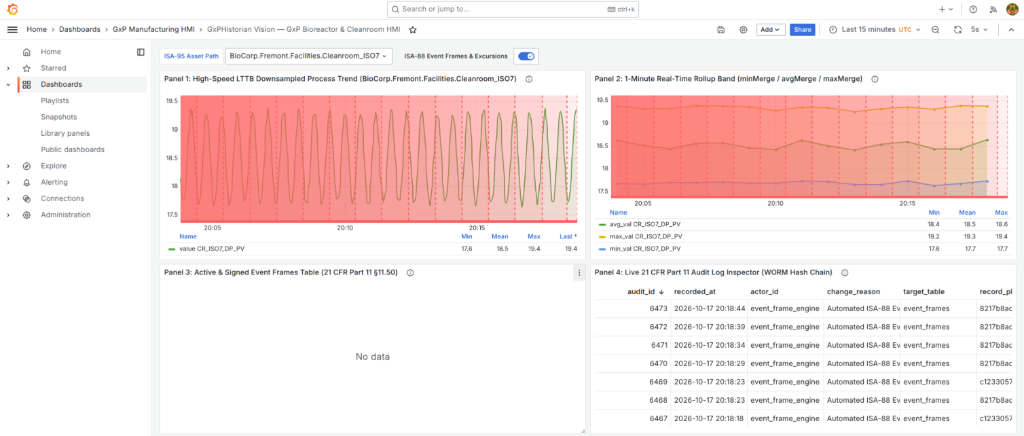
1. Accessing the Operator HMI
- Dashboard URL:
http://localhost:3020/d/gxphistorian-gxp-bioreactor-hmi - Default Credentials (
.env):- Username:
admin - Password:
GxP_Grafana_2026!
- Username:
- Provisioned Definition Files:
- Datasources:
provisioning/grafana/datasources/datasources.yml - Dashboard JSON:
provisioning/grafana/dashboards/gxphistorian_bioreactor_hmi.json
- Datasources:
2. Auto-Provisioned Datasources
On container startup, Grafana automatically configures two datasources with deterministic UIDs:
| Datasource Name | UID | Plugin / Engine | Target Database | Purpose |
|---|---|---|---|---|
ClickHouse-Telemetry-Archive | clickhouse_archive_uid | grafana-clickhouse-datasource | pi_historian (clickhouse-archive:9000) | High-speed LTTB process trends & 1-minute AggregatingMergeTree rollup bands. |
PostgreSQL-Part11-Control-Plane | postgres_control_uid | postgres | pi_control_plane (postgres-control:5432) | Dynamic $asset_path template variables, ISA-88 Event Frame annotation overlays, and live 21 CFR Part 11 WORM audit table. |
3. Asset-Relative Switching & Event Frame Overlays
Dynamic $asset_path Selector (PI Vision Asset Context Drop-Down)
The top navigation bar provides an $asset_path variable populated live from PostgreSQL:
SELECT asset_path::text AS __value, asset_name || ' (' || asset_path::text || ')' AS __textFROM assetsORDER BY asset_path::text;Switching $asset_path (e.g., from BioCorp.Fremont.USP.Bioreactor_201 to BioCorp.Fremont.DSP.Chrom_Skid_01 or BioCorp.Fremont.Facilities.Cleanroom_Suite_104) dynamically updates all trend panels and Event Frame tables on the screen.
Automated ISA-88 Event Frame Annotations Overlay
Critical excursions and batch runs stored in PostgreSQL event_frames are automatically rendered as shaded time-region overlays across the process trend panels:
SELECT start_time AS time, COALESCE(end_time, NOW()) AS timeEnd, event_name || ' [' || severity || ']' || CASE WHEN signed_by IS NOT NULL THEN ' (Signed: ' || signed_by || ')' ELSE ' (UNSIGNED)' END AS text, event_template AS tagsFROM event_frames efJOIN assets a ON ef.asset_id = a.asset_idWHERE a.asset_path::text = '${asset_path}' AND $__timeFilter(start_time);4. Dashboard Panels
| Panel | Title | Datasource | Key Query / Technical Feature |
|---|---|---|---|
| Panel 1 | High-Speed LTTB Process Telemetry Trend (WHERE quality >= 192) | ClickHouse (clickhouse_archive_uid) | Uses largestTriangleThreeBuckets(300)(ts, val) joined with dictGet('pi_historian.pg_asset_tags', ...) to render peak-preserving process curves for the selected ${asset_path}. |
| Panel 2 | 1-Minute Real-Time Rollup Band (minMerge / avgMerge / maxMerge) | ClickHouse (clickhouse_archive_uid) | Queries pi_historian.sensor_rollup_1m (GROUP BY tag_id, bucket_1m) to display pre-aggregated 1-minute mean, minimum, and maximum envelopes. |
| Panel 3 | ISA-88 Batch & Excursion Event Frames (21 CFR Part 11 Status) | PostgreSQL (postgres_control_uid) | Displays event_id, event_name, severity, start_time, end_time, captured_metrics (peak_val, avg_val), signed_by, signature_meaning, and signature_hash. |
| Panel 4 | 21 CFR Part 11 Cryptographic WORM Audit Trail (part11_audit_log) | PostgreSQL (postgres_control_uid) | Live inspector showing audit_id, recorded_at, actor_id, change_reason, target_table, operation, prev_hash, and row_hash. |